Codondex – large scale sequence amplification
Exploiting ncDNA-Protein Signature Topologies
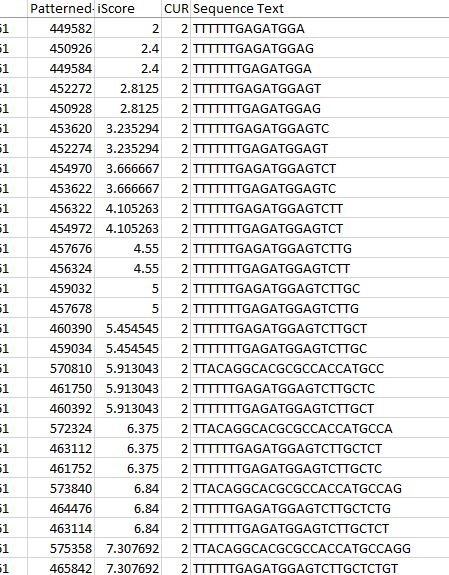
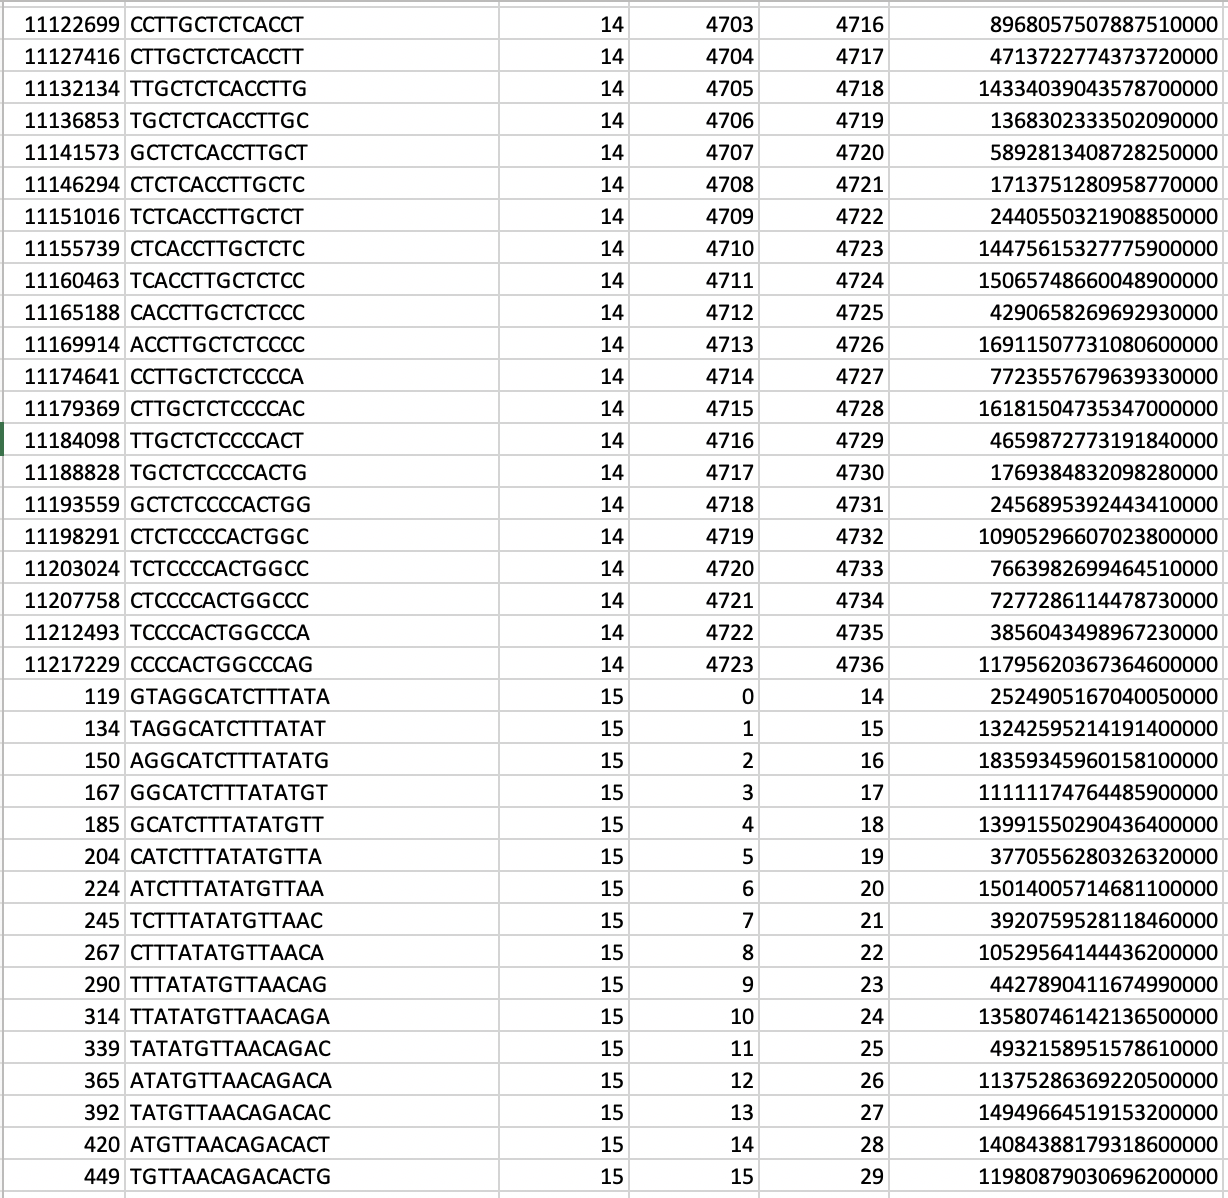
In our TP53 example - 400 nucleotides are amplified to generate +77000 k-mers ("subsequences"), a total of 10,735,712 nucleotides.
Example: each of 4 mRNA or protein sequences [P1-4] of a cell/gene
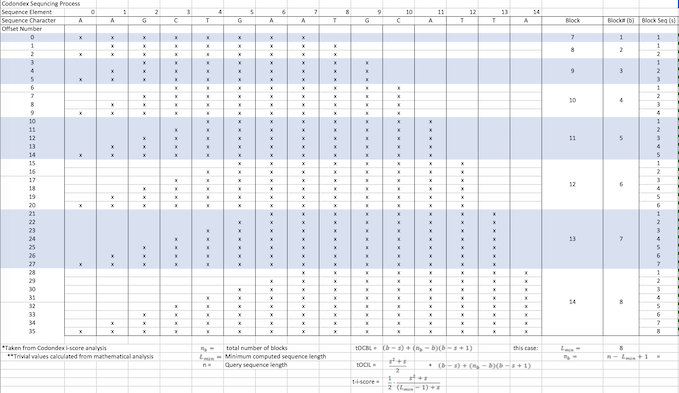
- Compute ncDNA sequence into k-mers >7 letters
- For sequence 'TGTGGGCCCACA' associated with transcript Protein or mRNA [P1] its k-mers are:
TGTGGGCC|GTGGGCCC|TGTGGGCCC|TGGGCCCA|GTGGGCCCA|TGTGGGCCCA|GGGCCCAC|TGGGCCCAC|
GTGGGCCCAC|TGTGGGCCCAC|GGCCCACA|GGGCCCACA|TGGGCCCACA|GTGGGCCCACA|TGTGGGCCCACA
- For sequence 'TGTGGGCCCACA' associated with transcript Protein or mRNA [P1] its k-mers are:
- Associate each of these subsequences with signature of P1.
- Its highest recurring k-mer is TGGGCCCA.
- Compute k-mers ncDNA sequences associated with [P2-4]
- Use ncDNA k-mers and their P1-P4 signature associations to discover ncDNA k-mer topology conferred to the set
From this we derive Codondex i-Score and two varieties of Protein Vector, which expose fine distinctions between k-mers of same-gene transcripts using intron-protein/mRNA pairs.
We use a variety of metrics to analyse the results we obtain. i-Score is a metric that attempts to normalise the amount of smaller or equal length k-mers found within the subsequence of an offset. It factors in the length of the subsequence in order to better compare to shorter offsets which generally will have smaller numbers of. We use this to rank the transcript vectors that are fundamental to our analysis.
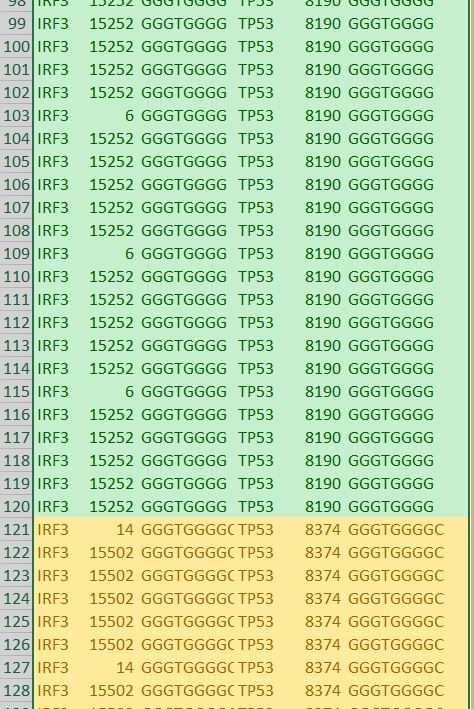
Inclusiveness is another metric we use which equates to the number of times an identical k-mer is found in other places throughout the transcript. This is often important in genomics and allows us another point of validation in future analysis.
We also discovered and ranked thousands of statistically dominant k-mers in multiple gene transcripts. These are unrelated by their sequence text, are of equal length and recur with equal frequency. This symmetry is unrelated to reverse complements and inverted repeats, which we can precisely predict using k-mer recurrence data exclusively.
How do I get started?
Sign up, upload and we will make available several reports to identify target subsequences of interest. See the processed examples on our site.
